Categories
Background

Caselaw Visualizer

Case Law & Interactive Visualizations

I created this blog to provide creative ways to visualize and interact with American caselaw. Although the information provided is meant to be engaging and thought-provoking, it is not meant as a research tool. If you would like to use the data provided for research, contact me to discuss the analytical methods and heuristics used to generate the content seen here.

Background

The Harvard Law School’s Caselaw Access Project

In 2018, the Harvard Law School Library’s Innovation Lab launched its Caselaw Access Project, providing public access to the full corpus of published U.S. case law.

“Between 2013 and 2018, the Library digitized over 40 million pages of U.S. court decisions, transforming them into a dataset covering almost 6.5 million individual cases. The CAP API and bulk data service puts this important dataset within easy reach of researchers, members of the legal community and the general public.”

Harvard Law Today (here)

This dataset has not only served the research community, it has also been used to create fun applications including a caselaw lymrick generator and caselaw color visualizer.

“Decedent was delicate, just sick.
In some spots the undergrowth was thick.
The defendant, Chas.
The defendant, Charles.
The roadway was not oily or slick.”

A Caselaw Limerick (here)

The public availability of these 6.5 million cases, opened up the possibility for unprecedented application of corpus linguistics and natural language processing methods on U.S. caselaw.

I created this Caselaw Visualizer Project as a way to demonstrate, through short examples, what analyses are possible and how this vast amount of data can be visualized.

Methods

The Case.Law’s bulk data service was used to download the full dataset for state and federal caselaw. Python 3 was used along with the Natural Language Processing Toolkit (NLTK). The data was visualized through interactive javascript-based charts created using Toast UI Charts.

Data Processing & Normalization

Distribution of Cases

The Caselaw Access Project “includes all official, book-published United States case law — every volume designated as an official report of decisions by a court within the United States.

Any corpus-based analysis, therefore, must be done using frequency not raw counts as the various jurisdictions within the U.S. contain vastly different numbers of cases and of published words. This variation is also evident within jurisdictions, as each court and judge is not homogeneously prolific.


<tip>

Instructions: Explore the interactive data visualizations on this site by clicking on the data points you wish to learn more about. On wider screens, depending on the type of visualization, you may see the option to display only the states you wish to learn more about on certain types of charts.

Troubleshooting: If you experience issues viewing or interacting with the visualizations, please use a non-Firefox desktop browser.

</tip>


The following chart demonstrates this point, showing only state court cases:


Because the data set does not include the following categories of cases, any generalizations gathered from the corpus, must be read in context.

The following chart contains federal cases divided by circuit and court.


Substantive v. Procedural Cases

As mentioned the Caselaw Access Project “includes all official, book-published United States case law — every volume designated as an official report of decisions by a court within the United States.” This mean that the dataset contains not only substantive caselaw, but also procedural cases such as simple denials of Certiorari. See the following example from the Supreme Court of the US and the Supreme Court of Alabama denying Certiorari.

Complete Opinion from the Supreme Court of the United States:

C. A. 6th Cir. Certiorari denied.

515 U.S. 1145 (1995) (SCOTUS)

Complete Opinion from the Supreme Court of Alabama:

HARWOOD, Justice.

Petition of Early Lee Gaskin for Certiorari to the Court of Criminal Appeals to review and revise the judgment and decision of that Court in Gaskin v. State, 53 Ala.App. 64, 297 So.2d 388.

Writ denied.

HEFLIN, C. J., and MERRILL, MADDOX and FAULKNER, JJ., concur.

297 So. 2d 391 (1974) (Alabama Supreme Court)

As a proxy for substantive legal analysis, case length was used. If opinions contained 50 or more words, they were included in analyses and visualizations. If opinions contained fewer than 50 words, they were not included in either analyses or visualizations. Words were counted using Python’s NLTK Tokenizer, ignoring punctuation.

For state cases, the proportion of “procedural” cases (i.e., cases shorter than 50 words) varies significantly.


A similar phenomenon can be seen in federal cases. Here we can see that the Supreme Court of the United States has the highest number of “procedural” cases, most of which are likely denials of Certs.

Normalization by Word Count and by Case Count

As stated above, the various courts and jurisdictions within the dataset vary drastically both in number of cases published and in number of words published. Here are geographical visualizations of the cases and words published.

The same map measuring the number of cases is discernibly different.


If you would like to learn more about this project or would like to contribute to its growth and maintenance, contact me on Twitter or on LinkedIn.
Categories
Caselaw Visualizations

SCOTUS Opinions by Political Party

Relative Number of SCOTUS Opinions by Nominating President & Political Party

The following sunburst diagram depicts the number of opinions authored by the US Supreme Court Justices organized by their nominating president’s political party. The graph is built on data made available by the Harvard Law School Library’s Case Access Project (found at Case.Law). As such, it covers published federal cases up to 2018 with additional restrictions found here.

In other words, the diagrams below can answer the question:

Which political party's nominated Justices have been the most prolific?

Being prolific is defined by the number of opinions authored or coauthored by each Justice. When viewing the entire dataset, we get the following (potentially overwhelming) diagram. The Justices are labelled as:

Justice = "(Year Joining SCOTUS) Full Name, n=#Opinions authored or co-authored"

Below this diagram there is another version, which is interactive and only shows a subset of the data at a time for a more visually pleasing experience.

To navigate the interactive diagram, click on any party or president that you would like to see in more detail. To “zoom out” click on the center of the diagram.

Notes

To begin answering this question, I filtered the federal cases on Case.Law’s dataset by using the Supreme Court of the United State’s court ID number. I then analyzed each case’s opinion(s) to find their authors. Since many (if not all) cases in Case.Law’s dataset were scanned and then underwent optical character recognition, the dataset contained errors such as the following:

Justice Brandeis, for example, is referred to as:

"Mr. Justice Beakdeis", "Mr. Justice BeaNdeis", "Mr. Justice BhaNdeis", "Mr. Justice BkaNdeis", "Mr. Justice Brakdeis",...

Justice Peckham, as another example, is referred to as:

Justice Peckham is referred to as: ["Mr. Justice Peckhaai", "Mr. Justice Pbckham", "Mr. Justice Pecrham", "Mr. Justice Peckuam," ...]

Opinions written by each Court’s Chief Justice sometimes do not refer to the author by name. Rather they merely cite to the “Chief Justice,” or sometimes as:

"Ch. Justice.", "The Chief Justice.", "Ch.. J.", "The CHIEF JUSTICE:", "Tbe Chief Justice", "Tlie Chief Justice', 'C. J.:', "Ch.J.", "Chief' JuJlice.", "Cb. J.,", "Ch; J.', "Ch.' J.", "■ The CHIEF JUSTICE", "The. CHIEF .JUSTICE", "Ch. Justice,", 'Ch. J..", "The CHIEF'JUSTICE", "The CHIEF-JUSTICE", "The Chief Justice. .", ...

When this was the case, the date of the case was used to determine authorship. Because of these “noisy data” issues, the diagrams should be taken with a grain of salt. I worked to clean the data as much as possible, but there may still be erroneous or missing attributions.

Lastly, if the same justice was nominated twice by different presidents (e.g., for Associate Justice then for Chief Justice), the Justice is shown twice on the graph, as relevant. The Case.Law dataset from which this graph was built contains cases up to 2018 but seems to lack a complete coverage of cases in the 2010s.


This post is part of the Caselaw Visualizer Project. For a description of the dataset and the processes used to generate these visualizations, click here. The data was made available by the Harvard Law School Library’s Case Access Project (found at Case.Law). For information about me, click here.

Categories
Caselaw Visualizations

Does the Flu “Infect” the Courts? Will COVID-19?

COVID-19 & Influenza’s Footprints in American Case Law

Throughout this series, we have analyzed the case law of diseases ranging from Yellow Fever, to HIV, to Smallpox. We’ve seen how certain epidemics seem to leave disproportionately large footprints in American case law while others are barely represented. Certainly, the personal health effects, business interruptions, and lasting economic consequences of the COVID-19 global pandemic have already shown themselves to be particularly prone to litigation:

Consumers continue to seek refunds for goods and services that have been disrupted by the COVID-19 pandemic, with colleges and universities being a particular target. Consumers also have targeted retailers for alleged price-gouging behavior. And, we continue to see new cases involving disputes over the applicability of business interruption and civil authority coverage to COVID-19 shutdowns.

Megan Mullins, Niall Paul, & Juseph Schaeffer of Spilman Thomas & Battle, PLLC, Unprecedented: COVID-19 Litigation Trends – Issue 6, JDSUPRA

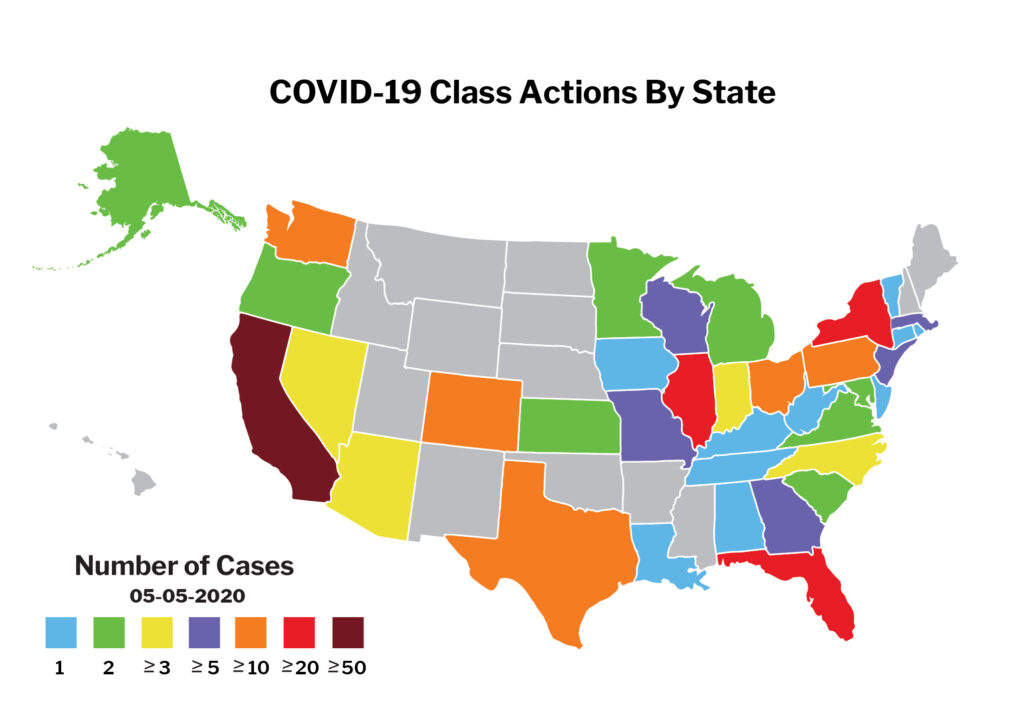
Even if we focus specifically on class action suits, as of May 15, 2020, over 300 cases have already been filed across the United States, with the largest concentration in California.

Elise Haverman & Julianna Thomas McCabe of Carlton Fields, The Litigation Curve Does Not Flatten: COVID-19 Class Action Filings Approach 300, JDSUPRA, May 11

As states and municipalities in the US begin to relax stay-at-home orders and businesses begin to reopen, the following questions will likely lead to a further increase of COVID-19-related litigation:

Will wrongful death lawsuits expand beyond the meat-processing and cruise industries?

Will any college or university avoid a refund lawsuit?

Will employers face lawsuits over their use of the CARES Act funds?

How will force majeure cases be decided?

Are more fraud and whistleblower complaints on the horizon?

Megan Mullins, Niall Paul, & Juseph Schaeffer of Spilman Thomas & Battle, PLLC, Unprecedented: COVID-19 Litigation Trends – Issue 6, JDSUPRA (paraphrased)

Given the immense breadth and depth of these questions, it is very likely that the oncoming wave of litigation will last for years to come. For now, however, we can look at the legal and political footprint of influenza (the flu) as a backdrop against which the COVID-19 cases may be compared. In fact, just as COVID-19 has become a political talking point (see the analysis by FiveThirtyEight and their graph below), so too have flu epidemics.

Seth Masket, How Political Is The Coronavirus Pandemic Already?, FiveThirtyEight

For example, Michele Bachmann, a Republican member of Congress until 2015, attempted to find an ultimately innacurate connection between the swine flu epidemic of 2009 and the Democratic Party.

I find it interesting that it was back in the 1970s that the swine flu broke out then under another Democrat president, Jimmy Carter. And I’m not blaming [the 2009 swine flu epidemic] on President Obama, I just think it’s an interesting coincidence.

Michele Bachmann interview with Pajamas Media in April 27, 2009

PolitiFact addressed the factual inaccuracies in Bachmann’s statement as well as its logical gaps:

The president in 1976 was Gerald Ford — a Republican….So Bachmann is wrong about a Democrat being in charge during the 1976 outbreak and she fails to note the swine flu death in 1988. Hmmm. Two swine flu incidents during Republican administrations. By Bachmann’s logic, we should find that “interesting.” But we don’t. It’s ridiculous for her to suggest a partisan link with a deadly disease. That’s not just a mistake, that’s absurdly false.

Bill Adair, Michele Bachmann wrong that swine flu broke out under Carter, PolitiFact (emphasis added)

Going back to the case law footprint of the flu, we see the peaks and valleys of litigation roughly aligning with historical influenza epidemics in the United States (Major U.S. Epidemics), starting with 1889–1890 flu pandemic in which over 1,000,000 died worldwide.

<tip>

Instructions: Explore the interactive data visualizations on this site by clicking on the data points you wish to learn more about. On wider screens, depending on the type of visualization, you may see the option to display only the states you wish to learn more about on certain types of charts.

Troubleshooting: If you experience issues viewing or interacting with the visualizations, please use a non-Firefox desktop browser.

</tip>

Specifically, we see visible increases after the 1889–1890 influenza pandemic, the 1918–1920 influenza pandemic, and the “Hong Kong” and “London” flu epidemics of 1968–1970 and 1972.


‘Influenza’ or the ‘Flu’?

Just for the sake of interest, I wanted to compare the use of “flu” and “influenza” to get a sense of how courts refer to the disease.

Etymologically, “[i]nfluenza earned its name from an Italian folk word that attributed colds, cough, and fever to the influence of the stars. Later the term evolved into influenza del freddo—’influence of the cold.‘” “The first influenza pandemic occurred around 1580, and the second in 1743, the latter spreading from Rome to England and introducing the word flu to the English.

For the grammar nerds, it’s notable that:

All of the great (read: notorious) illnesses seem to start with a definite article: the plague, the measles, the clap. Flu is no exception, appearing with the earliest English uses in the first half of the 19th century, about 100 years after the longer form entered English:

‘I have had a pretty fair share of the Flue.’

— Robert Southey, letter, 13 Aug. 1839.

‘Tis the (Flu) Season: The History of ‘Influenza’, Merriam-Webster

Concluding the Series

Over the course of these last three posts, we’ve covered some of the connections between communicable diseases, epidemics, and case law. Through geographical and diachronic analyses of the Case.Law dataset, we’ve seen how the public health, sociological, and economic dimensions of each disease outbreak affect its footprint on American case law and the legal system at large.

Life in the Time of Covid-19 is totally unprecedented.” So too may be COVID-19’s effect on the onslaught of lawsuits making their way through the American legal system. Only time will tell how this global crisis will affect judicial decisions and the case.law dataset in the decades to come.


<methodology>

Word frequency for each state is determined by dividing the number of times the target word(s) appears over the total number of words in each state’s corpus (the total combined body of case law).

Word Frequency =(Word Count of the Target Word(s))/(Total Word Count)

Case frequency for each state is determined by dividing the number of cases that contain the target word(s) over the total number of cases in each state.

Case Frequency =(Cases that Contain the Target Word(s))/(Total Number of Cases)

</methodology>

Do you have any guesses or explanations about the findings shown above? Do you have any additional visualizations concerning epidemiology and law? Let me know @JoaoMarinotti on Twitter. This post is part of the Caselaw Visualizer Project. For a description of the dataset and the processes used to generate these visualizations, click here. The data was made available by the Harvard Law School Library’s Case Access Project (found at Case.Law). For information about me, click here.

Categories
Caselaw Visualizations

Trends in Epidemic Lawsuits – A Culture of Litigation?

According to several media outlets, the COVID-19 global pandemic shares many similarities to the Spanish Flu.

Just like COVID-19, the Spanish Flu “started as a mild flu season, not different from any other. When its first wave hit in the spring of 1918, the Spanish flu seemed like just another flu. But then the second wave began at the end of summer.

Spanish flu was the most devastating pandemic ever recorded, leaving major figures like medical philanthropist Bill Gates to draw comparisons to the ongoing COVID-19 pandemic.”

Peter Schelden, What 1918 Spanish Flu Death Toll Tells Us About COVID-19 Coronavirus Pandemic, MedicineNet; see also Forbes, World Economic Forum, The Economist, & Vox

<tip>

Instructions: Explore the interactive data visualizations on this site by clicking on the data points you wish to learn more about. You may zoom into timelines by selecting the horizontal span you wish you see.

Troubleshooting: If you experience issues viewing or interacting with the visualizations, please use a non-Firefox desktop browser.

</tip>

While the medical and economic similarities are still being studied, one crucial different is already apparent:


The Spanish Flu, also known as the Influenza Pandemic of 1918-1919, did not leave a heavy footprint in American caselaw. In fact, 2 of the 4 total cases referring to the Spanish Flu only do so once and only as a way to analyze the actual topic of the cases, which were the Swine Flu (1978) and COVID-19 (2020).

In the previous post, “Epidemiology through Caselaw – Learning From Yellow Fever,” we noted how the geographical spread and historical epidemics of diseases can be analyzed and visualized through empirical analyses of caselaw. But why is it that there are already 1000+ “COVID-19” cases filed, when the supposedly comparable Spanish Flu barely left a mark in caselaw? Of course, the total number of published substantive cases in the dataset has significantly increased since 1918, but not sufficiently to account for the sheer number of immediately filed COVID-19 cases:


To get a better sense of how the legal footprints of recent epidemics differ from earlier crises, let’s take a look at three early 20th-century epidemics in comparison to the HIV, Hepatitis B, and Swine Flu outbreaks in the late 20th and early 21st centuries.


vs.


While it is clear that the number of HIV-related cases far surpassed that of the earlier epidemics, the story for Hepatitis B and Swine Flu is not as clear. The epidemiological statistics shown below also do not provide a clear explanation.

HIV ~1 million

At the end of 2017, there were 1,018,346 adults and adolescents with diagnosed HIV in the US and dependent areas.

HIV Statistics Overview, CDC

Hepatitis B ~ 1 million

An estimated 862,000 people are living with Hepatitis B virus in the United States.

Viral Hepatitis, CDC, Updated 9, 2019

Swine Flu

From April 12, 2009 to April 10, 2010, CDC estimated there were 60.8 million cases (range: 43.3-89.3 million), 274,304 hospitalizations (range: 195,086-402,719), and 12,469 deaths (range: 8868-18,306) in the United States due to the (H1N1)pdm09 virus.

2009 H1N1 Pandemic, CDC

From this primary glance at the data, it seems that each disease and outbreak has an idiosyncratic impact on American caselaw. The health-related, business-related, insurance-related COVID-19 cases will reflect the unique circumstances we find ourselves in during this unprecedented global pandemic.


Related Visualizations


<methodology>

Word frequency for each state is determined by dividing the number of times the target phrase appears over the total number of words each state’s corpus (the total combined body of caselaw).

Word Frequency =(Word Count of the Target Phrase)/(Total Word Count)

Case frequency for each state is determined by dividing the number of cases that contain the target phrase over the total number of cases in each state.

Case Frequency =(Cases that Contain the Target Phrase)/(Total Number of Cases)

</methodology>

Do you have any guesses or explanations about the findings shown above? Do you have any additional visualizations concerning epidemiology and law? Let me know @JoaoMarinotti on Twitter. This post is part of the Caselaw Visualizer Project. For a description of the dataset and the processes used to generate these visualizations, click here. The data was made available by the Harvard Law School Library’s Case Access Project (found at Case.Law). For information about me, click here.

Categories
Caselaw Visualizations

Epidemiology Through Caselaw – Learning From Yellow Fever

The COVID-19 global pandemic has already left its legal footprint quickly making its way to the United States Supreme Court. Law firms, too, are wasting no time in preparing for the onslaught of client questions and legal cases related to the pandemic that is sure to come.

The profound impact of the measures being taken to contain the spread of the novel coronavirus (“COVID-19”) is creating a host of … legal concerns relate[d] to corporate governance, disclosure, contracts, financing, strategic transactions, employment and others.

White & Case; see also Sidley

Christopher Tung, of K&L Gates LLP, has even released a helpful flow chart mapping how COVID-19 may or may not trigger Force Majeure clauses in contracts (for businesses operating in Mainland China and Hong Kong).

The Legal Consequences of COVID-19 on Your Contracts: Force Majeure in Different Jurisdictions and Industries, and Some Practical Guidance

Not only has such disruption led to the legal questions above, it has already led to over 1,000 cases that contain the term “COVID-19” (as of April 20, 2020 on WestLaw; cases refers to legal cases not epidemiological cases). This is not the first time, however, that epidemics and pandemics have left lasting legal footprints. In this post and over the next few weeks, I plan to release a number of visualizations raising thought-provoking questions and potential lessons to learn from the impact of historical pandemics have had on the American caselaw.


Let’s begin with Yellow Fever as it offers a clear picture into how caselaw can be used to visualize the timeline, geography, and magnitude of disease-related disruptions to our daily lives.

<tip>

Instructions: Explore the interactive data visualizations on this site by clicking on the data points you wish to learn more about. On wider screens, depending on the type of visualization, you may see the option to display only the states you wish to learn more about on certain types of charts.

Troubleshooting: If you experience issues viewing or interacting with the visualizations, please use a non-Firefox desktop browser.

</tip>

Nowadays, “Yellow Fever can be prevented through vaccination and mosquito control” and the “vaccine is safe and affordable, and a single dose provides life-long immunity against the disease.” But that was not always the case; in 1699, Thomas Story journaled:

In this distemper had died 6, 7, and sometimes 8 in a day, for several weeks, there being few houses, if any, free of the sickness. Great was the fear that fell on all flesh! [He] saw no lofty or airy countenances nor heard any vain jesting to move men to laughter…But every face gathered paleness, and many hearts were humbled, and countenances fallen and sunk, as such that waited every moment to be summoned to the bar and numbered to the grave.

Thomas Story, A Quaker Diarist, Quoted in John Duffy, Epidemics in Colonial America, Baton Rouge: Louisiana State University Press, 1953.

The last yellow fever epidemic on the North American continent occurred in New Orleans, Louisiana” in 1905. The geographic concentration of this disease in the American South can be seen in the following map of US cases:

The first case of yellow fever to strike Louisiana occurred in 1769, but the first epidemic transpired in 1796 when 638 people (out of a population of 8,756) died from the disease, translating into a mortality rate of 72.86 per thousand. In the 100-year period between 1800 and 1900, yellow fever assaulted New Orleans for sixty-seven summers. Its main victims were immigrants and newcomers to the city, and for this reason it was also referred to as the “stranger’s disease.” The worst epidemic years coincided with some of the highest levels of Irish and German immigration into the city: 1847, 1853, 1854, 1855, and 1858.

Laura D. Kelley, 64 Parishes

Regarding the city’s valiant response in the 1905 epidemic, Rupert Boyce noted:

In one respect New Orleans has set an example for all the world in the fight against yellow fever. The first impression was the complete organization of the citizens and the rational and reasonable way in which the fight has been conducted by them. With a tangible enemy in view, the army of defense could begin to fight rationally and scientifically. The… spirit in which the citizens of New Orleans sallied forth to win this fight strikes one who has been witness to the profound gloom, distress, and woe that cloud every other epidemic city.

Rupert Boyce, Dean of Liverpool School of Tropical Diseases, 1905

But is was not just New Orleans that faced the heavy realities of Yellow Fever in the 20th century. Tennessee, Mississippi, Louisiana, and to some extent Kentucky all have disproportionately more cases about Yellow Fever than the rest of the United States.

Interestingly, it is possible to see in the caselaw the invention of Yellow Fever Vaccine in 1938. After 1938, the peak of cases about Yellow Fever crashed:


<methodology>

Word frequency for each state is determined by dividing the number of times “yellow fever” appears over the total number of words each state’s corpus (the total combined body of caselaw).

Word Frequency =(Word Count of "Yellow Fever")/(Total Word Count)

Case frequency for each state is determined by dividing the number of cases that contain “yellow fever” over the total number of cases in each state.

Case Frequency =(Cases that Contain "Yellow Fever")/(Total Number of Cases)

</methodology>

Do you have any guesses or explanations about the findings shown above? Do you have any additional visualizations concerning epidemiology and law? Let me know @JoaoMarinotti on Twitter. This post is part of the Caselaw Visualizer Project. For a description of the dataset and the processes used to generate these visualizations, click here. The data was made available by the Harvard Law School Library’s Case Access Project (found at Case.Law). For information about me, click here.

Categories
Caselaw Visualizations

“Privacy”

The COVID-19 global pandemic has already raised a number of serious privacy concerns. One such concern is the fear that the surveillance tools used by governments around the world to track and contain the spread of disease will not be discontinued once the pandemic is over. As Bloomberg News reported in its April 5 article Pandemic Data-Sharing Puts New Pressure on Privacy Protections:

“‘There is an understandable desire to marshal all tools that are at our disposal to help confront the pandemic,’ said Michael Kleinman, director of Amnesty International’s Silicon Valley Initiative. ‘Yet countries’ efforts to contain the virus must not be used as an excuse to create a greatly expanded and more intrusive digital surveillance system.'”

Bloomberg News, by Ben Brody & Naomi Nix

Social distancing has also led educational and governmental institutions to hastily adopt video conferencing software exposing themselves to security and privacy vulnerabilities.

“As Americans and others around the world attempt to continue working, learning, socializing, and more, the videoconferencing program has become an essential service, going from 10 million daily call participants at the end of 2019 to 200 million in March. But Zoom’s ballooning popularity is also resulting in newfound scrutiny over the software’s privacy flaws—including, potentially, from the Federal Trade Commission.”

Vanity Fair Hive, by Alison Durkee

This surge in news over privacy concerns led to the following analysis of the term “privacy” in American state caselaw.


<tip>

Instructions: Explore the interactive data visualizations on this site by clicking on the data points you wish to learn more about. On wider screens, depending on the type of visualization, you may see the option to display only the states you wish to learn more about on certain types of charts.

Troubleshooting: If you experience issues viewing or interacting with the visualizations, please use a non-Firefox desktop browser.

</tip>


If you had to guess which state disproportionately discusses the topic of privacy, what state would you guess? By proportion of cases, the winner is Alaska. By word frequency, the winner is Hawaii. Why do you think the courts of the lower 48 states have a lower proportion of cases and text discussing “privacy” than the courts of Alaska and Hawaii?


<methodology>

Word frequency for each state is determined by dividing the number of times the word “privacy” appears over the total number of words each state’s corpus (the total combined body of caselaw).

Word Frequency =(Word Count of Privacy)/(Total Word Count)

Case frequency for each state is determined by dividing the number of cases that contain “privacy” over the total number of cases in each state.

Case Frequency =(Cases that Contain Privacy)/(Total Number of Cases)

</methodology>


The raw number of privacy-containing cases in California and New York, however, outnumber all others as the following bubble chart demonstrates.


Do you have any guesses or explanations about the findings shown above? Do you have any additional visualizations concerning privacy and law? Let me know @JoaoMarinotti on Twitter. This post is part of the Caselaw Visualizer Project. For a description of the dataset and the processes used to generate these visualizations, click here. The data was made available by the Harvard Law School Library’s Case Access Project (found at Case.Law). For information about me, click here.

Categories
Background

About Me

My name is João Marinotti and I am a Visiting Fellow at the Yale Law School Information Society Project and a Postdoctoral Fellow at Indiana University Maurer School of Law’s Center for Law, Society and Culture. I started this project as a student at Harvard Law School (J.D. ’20) and had a blast using my educational background in linguistics, informatics, and law to create this blog. Follow me on Twitter and LinkedIn for updates on this and other projects. If you have suggestions or want to contribute to the blog, don’t hesitate to DM me on Twitter.

css.php